
News › Cotton
 Textiles: Spools of opportunity for India
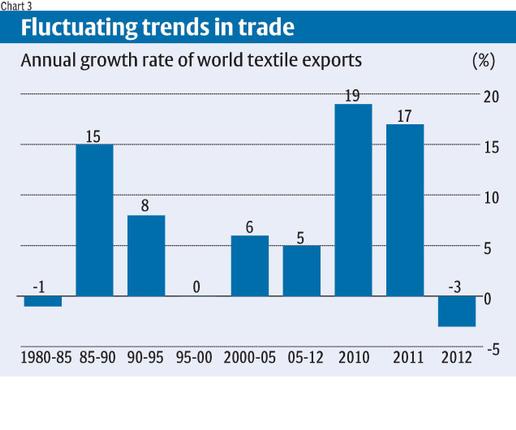
Relative cost advantages and the changing geography of world production and trade could work to our advantage 18 February, 2014
For many years now, developing countries have dominated the trade in textiles. The relative labour intensity of parts of the textile value chain has combined with low barriers to entry into the industry to give poorer countries an advantage in production and trade. This has held even when a few global majors dominate the value chain leading up to the supply of textiles to retail markets in the US and the European Union. Even they must locate the cutting, sewing and trimming operations in the garment industry in low-cost locations, often fed with cloth imports from abroad.
But with design, value chain management and retail distribution under the control of major global players, margins for most developing country producers remains low. Especially for those that have not managed to vertical integrate production and establish a textile production complex.
For countries performing well in this business, the rewards have been significant in recent years. Cotton yarn production in 40 leading producers rose, according to Euromonitor International (using UN data), from 31 million tonnes in 2008 to 46 million tonnes in 2013 or at 8.4 per cent per annum (Chart 1). Production was dominated by China and India, partly because these countries were important suppliers to both world markets and their own substantial domestic markets (Chart 2). This domination at the yarn production stage is of considerable relevance, even though discussions on the geography of the textile business have focused on the trade.
The global textiles and clothing market rose in value from $480 billion in 2005 to $708 billion in 2012. That performance, over a period when much of the world economy was mired in recession, is remarkable given that the global textile market has been quite volatile (Chart 3). The late 1980s were a golden age for the textiles trade, after which growth rates have fallen and averaged between 5 and 7 per cent between 2000 and 2012. However, 2010 and 2011 were remarkable growth years.
Although 2012 was once again a bad year, possibly influenced by the crisis in Europe that resulted in a sharp fall in imports to that region, the evidence points to a recovery in 2013.
Bouncing back
An October 2013 estimate by PCI Fibres suggested that the apparel trade by weight, which was down 2 per cent in 2012, was likely to bounce back by 4 per cent to reach 16.5 million tonnes in 2013. In the case of textiles, defined as spun yarns, fabrics for onward processing, and household and technical articles, growth across all the fibre types was expected to rise by an estimated 7.5 per cent, to reach some 24.7 million tonnes.
Most developing countries have a special advantage in apparel exports. Globally, these grew in value from $278 billion in 2005 to $412 billion in 2012. The top ten developing country suppliers accounted in 2012 for 58 per cent of those exports. The most important global markets were the EU (38.5 per cent of total imports, with 20.3 per cent being extra EU), the US (19.9 per cent) and Japan (7.7 per cent) which, between them, accounted for 66 per cent of global imports of clothing in 2012. While other markets such as Canada, Russia, Korea, Australia and Switzerland have grown in importance over time, they accounted for just 8.3 per cent of the total in 2012.
Dramatic changes
There have been dramatic changes in the relative position of individual countries in the global apparel trade league table. For example, Bangladesh, which was the 76th largest clothing exporter in 1980, has become the fourth biggest garment exporter currently. But the change in geography is quite generalised. This comes through from an analysis of the changing sources of developing country supplies in apparel exports to the US and the EU.
Consider the US. In 1970, Japan, which had joined the OECD in 1964, was the leading apparel exporter to the US. Hong Kong, South Korea, the Philippines, Mexico and Israel were among the top 10 exporters to that country. By 1980 Canada, the UK and Israel made way for China, India and Singapore. The Dominican Republic and Indonesia appeared among the top 10 in 1990 and Japan and Singapore exited. By 2000 Bangladesh and Thailand were present and were joined by Vietnam in 2012. There have been significant changes in ranks as well. The only element of relative stability has been that since 2000 China has topped the list of leading apparel exporters. It is possibly time for a change there. In the EU, while developing country apparel exporters have gained dramatically, some countries in the region such as Turkey and the peripheral countries of Europe have also benefited. Geographical proximity seems to matter here and perhaps the relocation of EU producers to peripheral countries explains the significant share of intra-EU exports.
Turkey has been the second largest exporter to the EU since 2000. Interestingly, it does not feature in the list of the top 10 suppliers to the US. This is also true of Tunisia and Morocco. That is because, besides geographical proximity, preferential market access is a factor explaining market shares in the EU.
Differential ability
However, success in the apparel trade does not reflect the strengths that can prove crucial in the long run. While the leading exporters of apparel were often also the leading exporters of textiles, there have been some exceptions. On the one hand China, India, Turkey and Pakistan have been significant exporters of textiles, besides garments, whereas Vietnam and Bangladesh have not been so. This points to the differential ability of developing countries to exploit the benefits of having a textile production complex and appropriating an increasing share of value added in the global value chain.
This ability to create a textile production complex partly explains China’s long-term resilience in the global textiles market. That ability is in turn related to the large domestic market that helps build the foundation for a strong industry. According to the China National Textile and Apparel Council (CNTAC), the size of the Chinese domestic apparel market doubled between 2005 and 2011, increasing in value terms from 700 billion yuan to 1,400 billion yuan.
Often margins in these markets are also higher, especially for domestic producers able to access these markets by themselves without being subject to pricing pressure from aggressive global buyers. These are factors explaining China’s long-term success. India too has many of these advantages. It has a large market for textiles, which has been growing rapidly, driven by a high-spending middle class and a large population.
Advantage India?
Yarn production rose from 4 billion kg in 2000 to 5 billion kg in 2013, and cloth production from 39 billion metres in 2000 to 63 billion metres in 2013. India was the sixth largest developing country exporter of garments to the US and fourth largest to the EU. It has an important presence in global yarn production. So it is in a position to expand its presence in the global textiles market and increase its market.
This is a real possibility also because rising labour costs in China are likely to erode its competitiveness. According to the Bureau of Labour Statistics of the US, average hourly compensation costs in Chinese firms rose from $0.60 in 2002 to $1.74 in 2009 with much of the increase occurring in recent years.
On the other hand, labour compensation (including pay for time worked, directly-paid benefits, excluding payment in kind of social insurance expenditures, and labour-related taxes) in India’s organised manufacturing sector has only risen from $0.68 an hour in 1999 to $1.46 in 2010. The rise among production workers (as opposed to all employees) has been lower, from $0.53 to $0.92 per hour. This could give India a competitive edge in industries such as textiles.
We should not be surprised, therefore, if new changes in the geography of textile production occur, with China losing its position at the top of the export league table and giving way to India in a labour-intensive sector such as textiles.